2024 Rewind: Polynomial Regression in Bambi
Overview of polynomial regression using Bambi, through projectile motion and fictitious planets
You are given a fair, unweighted 10-sided die with sides labeled 0 to 9 and a sheet of paper to record your score. (If the very notion of a fair 10-sided die bothers you, and you need to know what sort of three-dimensional solid it is, then forget it — you have a random number generator that gives you an integer value from 0 to 9 with equal probability. Your loss — the die was a collector’s item.)
To start the game, you roll the die. Your current “score” is the number shown, divided by 10. For example, if you were to roll a 7, then your score would be 0.7. Then, you keep rolling the die over and over again. Each time you roll, if the digit shown by the die is less than or equal to the last digit of your score, then that roll becomes the new last digit of your score. Otherwise you just go ahead and roll again. The game ends when you roll a zero.
For example, suppose you roll the following: 6, 2, 5, 1, 8, 1, 0. After your first roll, your score would be 0.6, After the second, it’s 0.62. You ignore the third roll, since 5 is greater than the current last digit, 2. After the fourth roll, your score is 0.621. You ignore the fifth roll, since 8 is greater than the current last digit, 1. After the sixth roll, your score is 0.6211. And after the seventh roll, the game is over — 0.6211 is your final score.
What will be your average final score in this game?
This problem is relatively straightforward, throwing a random number sequentially and adding to the solution integer if it meets all the conditions. This is fairly straightforward in python, the code for which can be seen in this git repository.
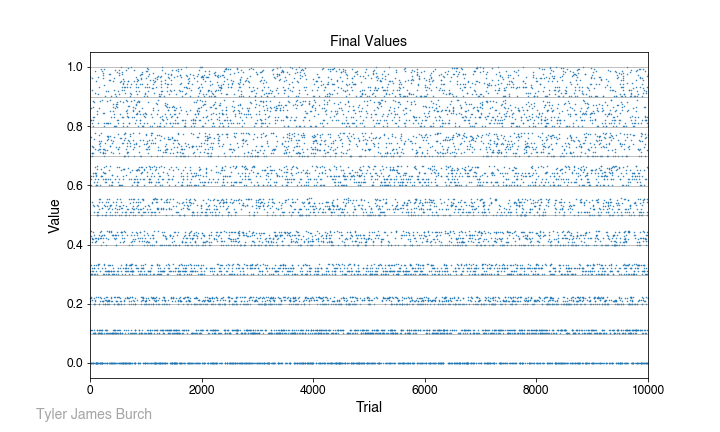
To get a guess of what to expect, we can consider if we start by rolling a 1, the solution space is forced to a regime between 0.111… and 0.10. Conversely, if we start with a 9, the solution space is more flexible, ranging from 0.999… to 0.90. Thus, with a broader solution space toward the top of the value spectrum, we expect a bias upward in comparison to just a random value over the space [0,9], which would be 4.5. After simulating many trials, we can plot the values returned and see that constrained solution space:

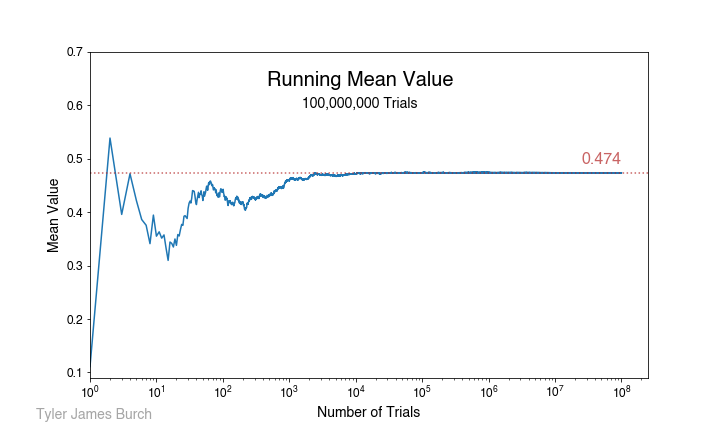
In fact, that is the solution we do see, resolving to a value of 0.454 after aggregating 100,000,000 attempts. The running mean as trials proceed are shown in the following plot:

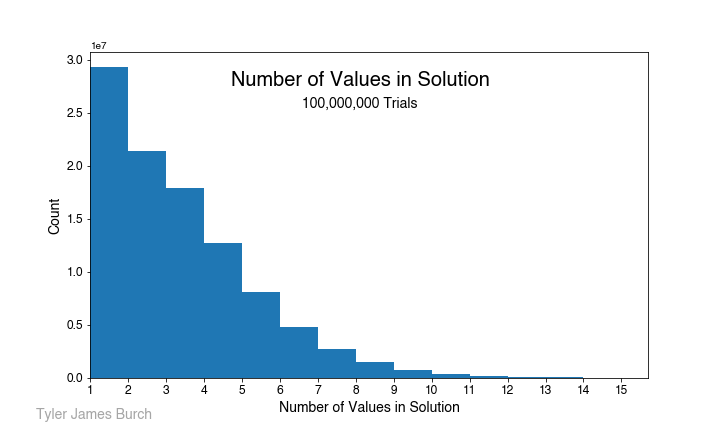
which resolves ultimately to the aforementioned value. One last sanity check I ran was a look at the length of values in the solutions, which should be monotonically decreasing, shown in the following plot.

Overview of polynomial regression using Bambi, through projectile motion and fictitious planets
A terminal user interface for Linear project management
A lightning-round collection of loose threads from 2025
Books I read in 2023
Who will win this year’s cup?
Books I read in 2022
Just how lucky have the 18-3 Bruins gotten?
Interoperability is the name of the game
Books I read in 2021
I got a job!
Books I read in 2020
Revisiting some old work, and handling some heteroscadasticity
Using a Bayesian GLM in order to see if a lack of fans translates to a lack of home-field advantage
An analytical solution plus some plots in R (yes, you read that right, R)
okay… I made a small mistake
Creating a practical application for the hit classifier (along with some reflections on the model development)
Diving into resampling to sort out a very imbalanced class problem
Or, ‘how I learned the word pneumonoultramicroscopicsilicovolcanoconiosis’
Amping up the hit outcome model with feature engineering and hyperparameter optimization
Can we classify the outcome of a baseball hit based on the hit kinematics?
Updates on my PhD dissertation progress and defense
My bread baking adventures and favorite recipes
A summary of my experience applying to work in MLB Front Offices over the 2019-2020 offseason
Books I read in 2019
Busting out the trusty random number generator
Perhaps we’re being a bit hyperbolic
Revisiting more fake-baseball for 538
A deep-dive into Lance Lynn’s recent dominance
Fresh-off-the-press Higgs results!
How do theoretical players stack up against Joe Dimaggio?
I went to Pittsburgh to talk Higgs
If baseball isn’t random enough, let’s make it into a dice game
Random one-off visualizations from 2019
Books I read in 2018
Or: how to summarize a PhD’s worth of work in 8 minutes
Double the Higgs, double the fun!
A data-driven summary of the 2018 Reddit /r/Baseball Trade Deadline Game
A 2017 player analysis of Tommy Pham