Letting Agents Drive Your Interactive Sessions with tmux
A workflow I’ve been using lately - pointing agents at a live REPL through tmux, with a file-redirect trick that makes it reliable.

This weekend I took on fivethirtyeight’s weekly Riddler question again. The original problem text can be found here.
If a baseball team is truly .500, meaning it has a 50 percent chance of winning each game, what’s the probability that it has won two of its last four games and four of its last eight games?
The solution to this was pretty straightforward. Basically my approach was to run a coin flip simulation 8 times, since those odds are 50/50, equivalent to a .500 team. I did this in python using a random boolean, where 1 was “heads” and 0 was “tails.” I first look at the subset of the first 4 of those, and if 2/4 are are “heads,” then I look at the full set of 8. If 4/8 are “heads,” then I consider this “passing.”
I run this simulation over and over, and find the ratio of passing to the total number of attempts, shown in this plot (note the log scaled x-axis):
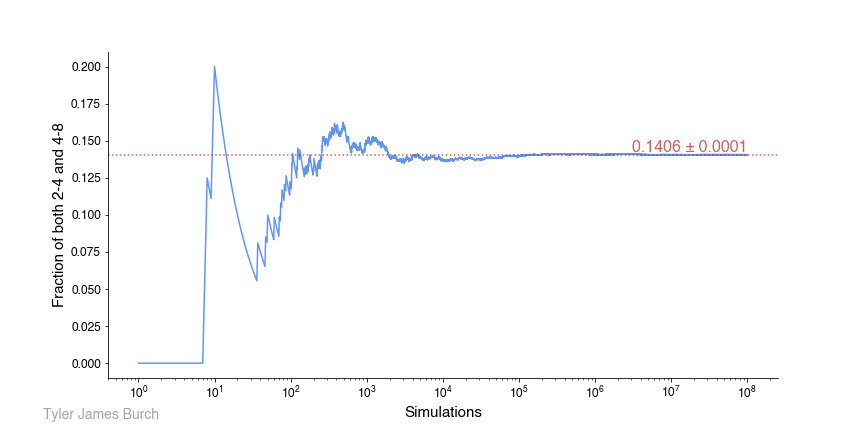
Since the simulation wasn’t very intensive, 100,000,000 attempts were made, converging on a probability of 0.1406 ± 0.0001. For the uncertainty, I took the 95% confidence interval, as calculated using the Agresti–Coull interval, where the CI is z*sqrt(p*(1-p)/N), for p “passing results,” N attempts, and z value of 1.96 corresponding to the 95% CI.
The full Jupyter notebook for this solution can be found here.
Riddler League Baseball, also known as the RLB, consists of three teams: the Mississippi Moonwalkers, the Delaware Doubloons and the Tennessee Taters.
Each time a batter for the Moonwalkers comes to the plate, they have a 40 percent chance of getting a walk and a 60 percent chance of striking out. Each batter for the Doubloons, meanwhile, hits a double 20 percent percent of the time, driving in any teammates who are on base, and strikes out the remaining 80 percent of the time. Finally, each batter for the Taters has a 10 percent chance of hitting a home run and a 90 percent chance of striking out.
During the RLB season, each team plays an equal number of games against each opponent. Games are nine innings long and can go into extra innings just like in other baseball leagues. Which of the three teams is most likely to have the best record at the end of the season?
The solution to this took a bit more involved simulation. What I did was reprise my simulation for the baseball yahtzee puzzle earlier this year, gut it out a little bit and adapt it to this specific problem, with the given actions and likelihoods.
The Jupyter notebook found here shows the complete game definition in the various classes as the top, and the simulation indicated. This simulation was a lot more intensive, I ended up doing each matchup 500,000 times for a total of 1,500,000 games.
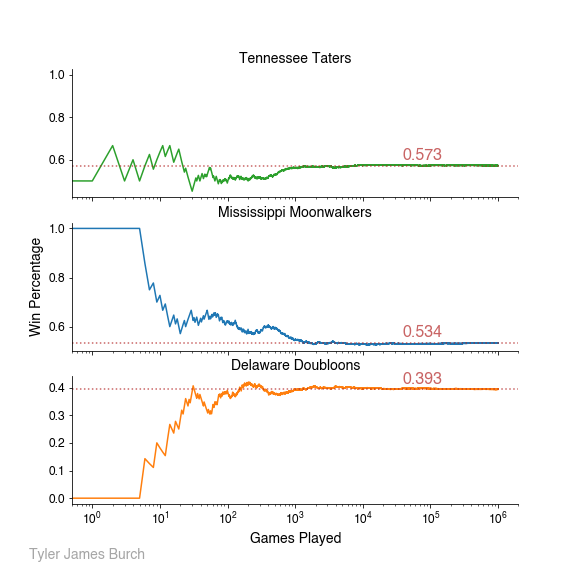
The solution found that:
The Tennessee Taters have the best record at a .573 winning percentage.
The Mississippi Moonwalkers were in the middle with a .534 winning percentage.
The Delaware Doubloons were the worst with a .393 winning percentage.
I also plotted winning percentage as games were played, to see how the solution evolved as games were simulated:
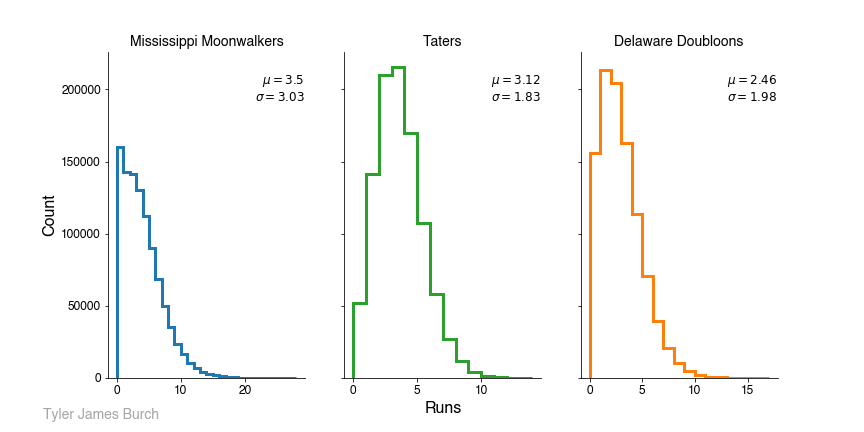
Also of interest was the scoring distribution of each team, to better understand the game as defined. Since we know the actions and rates of each team, it’s interesting to see exactly how those translate to runs within the confines of a standard baseball game.
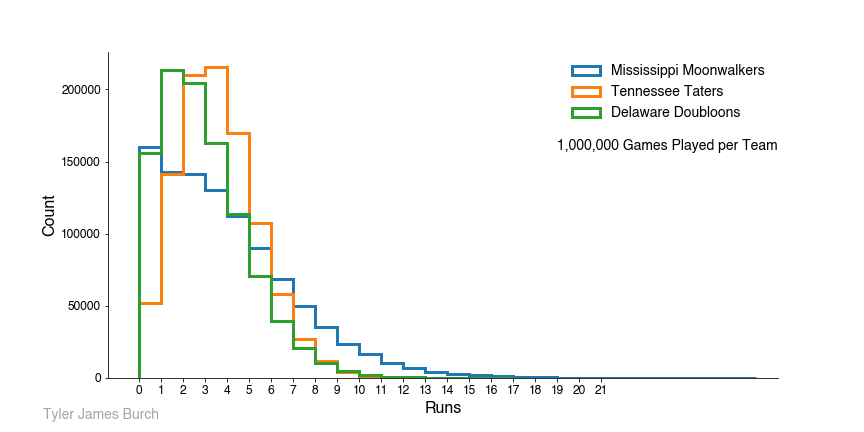
We can also overlay these onto one plot:
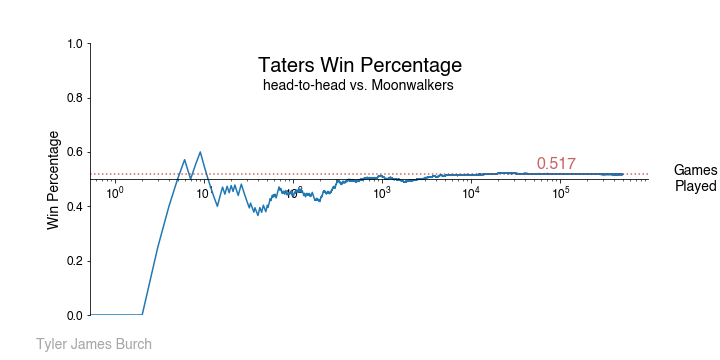
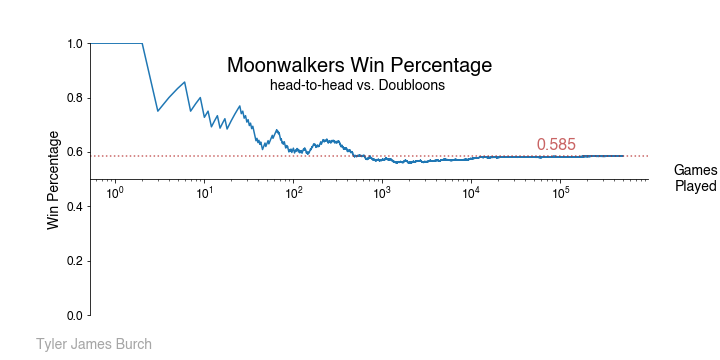
Last, we can look at head-to-head winning percentages. These plots were made from the winning team’s perspective, but to get the losing team’s winning percentage, you’d just mirror over the x-axis.

@misc{burch2019fivethirtyeight_fallClassic,
  author       = {Tyler James Burch},
  title        = {Fivethirtyeight Riddler: Which Baseball Team Will Win The Riddler Fall Classic?},
  year         = {2019},
  month        = {September},
  howpublished = {\url{https://tylerjamesburch.com/blog/statistics/fivethirtyeight_fallClassic}},
}A workflow I’ve been using lately - pointing agents at a live REPL through tmux, with a file-redirect trick that makes it reliable.
How much did the 1976 ‘Run for the Hoses’ actually slow the field?
Live Bayesian bracket predictions for the 2026 NCAA Tournament, updated daily.
Building a Bayesian offense-defense model for the 2026 NCAA Tournament, finding a Simpson’s paradox hiding in the correlation, and what running the same mode...
A deep dive into what orthogonal polynomials actually do under the hood, contributed to Bambi’s examples
Overview of polynomial regression using Bambi, through projectile motion and fictitious planets
A terminal user interface for Linear project management
A lightning-round collection of loose threads from 2025
Books I read in 2023
Who will win this year’s cup?
Books I read in 2022
Just how lucky have the 18-3 Bruins gotten?
Interoperability is the name of the game
Books I read in 2021
I got a job!
Books I read in 2020
Revisiting some old work, and handling some heteroscadasticity
Using a Bayesian GLM in order to see if a lack of fans translates to a lack of home-field advantage
An analytical solution plus some plots in R (yes, you read that right, R)
okay… I made a small mistake
Creating a practical application for the hit classifier (along with some reflections on the model development)
Diving into resampling to sort out a very imbalanced class problem
Or, ‘how I learned the word pneumonoultramicroscopicsilicovolcanoconiosis’
Amping up the hit outcome model with feature engineering and hyperparameter optimization
Can we classify the outcome of a baseball hit based on the hit kinematics?
Updates on my PhD dissertation progress and defense
My bread baking adventures and favorite recipes
A summary of my experience applying to work in MLB Front Offices over the 2019-2020 offseason
Books I read in 2019
Busting out the trusty random number generator
Revisiting more fake-baseball for 538
A deep-dive into Lance Lynn’s recent dominance
Fresh-off-the-press Higgs results!
How do theoretical players stack up against Joe Dimaggio?
I went to Pittsburgh to talk Higgs
If baseball isn’t random enough, let’s make it into a dice game
Random one-off visualizations from 2019
Books I read in 2018
Or: how to summarize a PhD’s worth of work in 8 minutes
Double the Higgs, double the fun!
A data-driven summary of the 2018 Reddit /r/Baseball Trade Deadline Game
A 2017 player analysis of Tommy Pham